
A digitizer-based methodology for converting P–θ diagram images into numerical pressure data for an internal combustion engine

Copyright © The Korean Society of Marine Engineering
This is an Open Access article distributed under the terms of the Creative Commons Attribution Non-Commercial License (http://creativecommons.org/licenses/by-nc/3.0), which permits unrestricted non-commercial use, distribution, and reproduction in any medium, provided the original work is properly cited.
Abstract
With the increasing adoption of electronically controlled marine engines, digital indicators have been widely used to monitor engine performance. However, because manufacturers restrict access to raw data, users are generally limited to processed results and graphical outputs, which constrain detailed combustion and performance analyses. This study proposes a digitizer-based methodology for converting P–θ diagram images obtained from digital indicators into crank angle-resolved numerical pressure data suitable for quantitative engine performance analysis. The proposed approach is applied to two electronically controlled two-stroke marine diesel engines: a MAN Energy Solutions 6S60ME engine (Engine A) and a Wärtsilä RT-Flex 96C engine (Engine B), both installed on operating vessels. P–θ diagram images are digitized to extract discrete pressure crank angle data, followed by linear interpolation to generate uniformly spaced datasets. B-spline interpolation is applied to improve data continuity and reduce numerical noise. The reconstructed data are validated against the digital indicator results provided by the manufacturer using the maximum compression pressure, maximum combustion pressure, and indicated mean effective pressure as representative parameters. The results showed that for Engine A, the digitized data exhibited errors within ±1.25 bar compared to the reference values, indicating that the proposed method is suitable for continuous practical application. For Engine B, although the indicated mean effective pressure showed a high agreement, larger deviations were observed in the maximum combustion pressure, revealing limitations associated with the engine type and operating conditions. The proposed methodology enables ship operators and fleet technical managers to analyze combustion characteristics quantitatively using existing graphical outputs without additional hardware installation, thereby supporting condition-based maintenance and preventive diagnostics.
Keywords:
Digitizer, Image-based data acquisition, Interpolation, In-cylinder pressure, Engine performance1. Introduction
Engine performance measurements are initially conducted during factory shop tests using dynamometers before installation on board ships. During these tests, the engine operating parameters and in-cylinder pressure data are measured under various load conditions and provided to shipowners in the form of shop test reports. These data are retained throughout the engine’s operational lifetime and are used for regulatory assessments, such as NOx emission calculations.
For conventional cam-type marine engines, in-cylinder pressure during operation is typically measured using mechanical indicators. Pressure diagrams are recorded on indicator paper, and the output is calculated manually using planimeters. However, this approach is subject to significant uncertainty and has limited repeatability. With the increasing adoption of camless electronically controlled engines, digital indicators have largely replaced mechanical systems [1], enabling higher accuracy through software-based analyses.
Despite these advances, continuous acquisition of crank angle-resolved in-cylinder pressure data under actual operating conditions remains limited. In most cases, only processed results such as maximum combustion pressure (Pmax), maximum compression pressure (Pcomp), indicated mean effective pressure (Pmi), and image files of pressure–crank angle (P–θ) and pressure–volume (P–V) diagrams are provided to end users [2]. These outputs allow only a relative comparison between the cylinders, rather than a detailed combustion analysis.
Access to crank angle-resolved pressure data enables additional analyses, including ignition timing, pressure rise rate, heat release rate, and expansion characteristics. This information is essential for diagnosing fuel valve malfunctions, exhaust valve leakage, blow-by severity, and cylinder-to-cylinder fuel injection imbalance. In low-speed two-stroke engines, the pressure increase rate is typically reported to be approximately 4 bar/°, and deviations from this value can lead to reduced compression pressure and increased fuel consumption.
The maritime industry is increasingly shifting toward condition-based maintenance and digital fleet management. However, manufacturers generally restrict access to raw measurement data owing to security, reliability, and intellectual property concerns. Consequently, ship operators seeking to implement independent condition-based maintenance strategies are limited to three alternatives: installing additional sensors, acquiring signals from existing sensor outputs, or analyzing graphical data provided by manufacturers. Among these approaches, image-based analysis requires no additional hardware investment and raises no warranty or safety concerns.
Therefore, this study proposes a digitizer-based framework [3] for reconstructing crank-angle-resolved in-cylinder pressure data from indicator images. The goal of this study is to (1) develop a reproducible procedure for reconstructing crank angle resolution pressure data from manufacturer P-θ images, (2) quantitatively verify Pcomp, Pmax, and Pmi based on ±1.25 bar, and (3) determine the scope and limits of the method by applying it to two different low-speed two-stroke engines.
2. Literature Review
2.1 Previous Studies on Combustion Chamber Data Acquisition
Zhou et al. reviewed representative cylinder pressure monitoring systems for marine engines, including the Kistler KiBox, AVL systems, MAN Energy Solutions PMI, and ABB Cylmate. They emphasized the importance of accurate crank angle positioning and the simultaneous measurement of pressure and crank angle signals, while noting that such systems are costly and primarily designed for expert users. To address these limitations, the authors developed an online monitoring system based on the LabVIEW virtual instrument platform [4].
Maurya et al. investigated combustion chamber data acquisition using piezoelectric pressure sensors. They showed that pressure correction, cycle averaging, and signal smoothing are essential for obtaining reliable combustion diagnostic information from in-cylinder pressure measurements [5].
Kaiktsis et al. analyzed the operating data from electronically controlled marine diesel engines for fault prediction. They found that parameters such as the maximum compression pressure and maximum combustion pressure alone were insufficient for accurate fault diagnosis. They emphasized the importance of injection timing information for reliable condition assessment [6].
2.2 Previous Studies on Digitizer-based Data Reconstruction and Measurement Uncertainty
Rowles demonstrated the feasibility of reconstructing brake-specific fuel consumption diagrams for naval applications using a Web Plot Digitizer and identifying key performance regions and characteristic curves from image data [7].
Ghazi and Botez digitized scanned engine performance charts using Engauge Digitizer and reconstructed engine mathematical performance model identification for flight management system trajectory prediction and optimization applications [8].
Gainey et al. investigated uncertainty in experimental engine research and reported that in-cylinder pressure measurements exhibited an uncertainty of approximately ±1.25 bar at a 95% confidence level [9].
While existing literature has focused on developing expensive commercial pressure measurement systems or reconstructing digitizers for aircraft performance maps, this study reconstructs crank-angle-resolution pressure data using only the P-θ images provided by the manufacturer from low-speed two-stroke marine diesel engines in operation. The digitizers are then applied to two different engine models for quantitative evaluation of the limits, thereby differentiating the research.
3. Methodology
3.1 Research Framework and Rationale
This study selects a digitizer-based approach to address the practical limitation that raw in-cylinder pressure data are not accessible to end users. In contrast, graphical indicator outputs are consistently available during ship operations. The overall research framework is designed to ensure reproducibility, minimal interference with onboard systems, and quantitative validation of the reference measurements.
First, the in-cylinder pressure is measured using the manufacturer’s digital indicators and treated as reference data. P–θ diagram image files generated under identical operating conditions are obtained and uploaded into digitizing software. Three reference points are defined to establish a two-dimensional coordinate system, minimize geometric distortion, and ensure consistent axis mapping.
Figure 1 illustrates the overall workflow of the proposed data reconstruction procedure. The ovals denote the start and end points, the rectangles represent the data processing steps, and the diamond indicates the decision step based on the allowable error criterion. In the final validation stage, the reconstructed data are accepted when the deviation from the digital indicator reference values remains within ±1.25 bar; otherwise, the image filtering condition, point extraction interval, and spline interpolation settings are adjusted, and the procedure is repeated.
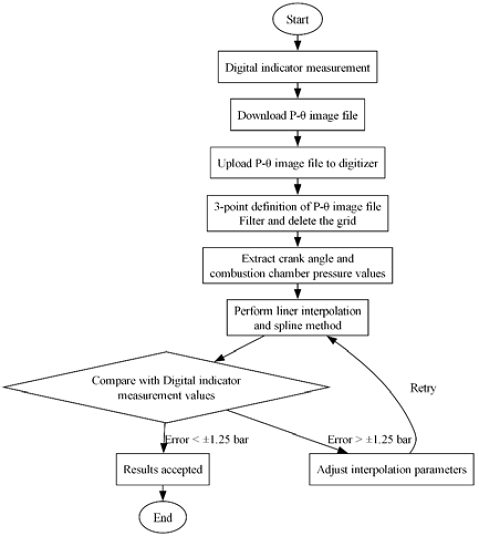
Diagram of analysis procedure
Image filtering is applied to remove grids, labels, and background noise, as such elements can introduce false data points during digitization. After extracting discrete pressure–crank angle data, numerical post-processing is applied to improve continuity and usability.
Because the digitized data are unevenly distributed along the crank angle, linear interpolation is initially applied to generate uniformly spaced data, owing to its robustness and numerical stability. However, linear interpolation alone introduces local noise, which is undesirable in derivative-based analyses. Therefore, the basis spline (B-spline), which is a piecewise polynomial interpolation method, is subsequently applied to smooth the data while preserving the global characteristics of the combustion pressure curve.
The reconstructed data are validated by comparison with digital indicator measurements. Based on uncertainty ranges reported in previous experimental studies, reconstructed data are considered reliable if deviations remain within ±1.25 bar.
3.2 Target Engines
Experimental data are collected from two operating vessels equipped with electronically controlled two-stroke marine diesel engines: a MAN Energy Solutions 6S60ME engine (Engine A) and a Wärtsilä RT-Flex 96C engine (Engine B). These engines were deliberately selected because they differ significantly in size, output range, combustion characteristics, and turbocharging configurations.
Table 1 summarizes the principal specifications of the target engines. The two engines differ substantially in the number of cylinders, power per cylinder, injection pressure, and turbocharging configuration. These differences can directly influence the shape of the combustion pressure curve, its local gradient, and the sensitivity around the peak pressure region. Therefore, this study allows both the applicability and limitations of the digitizer-based method to be evaluated across engines with distinct characteristics.

Specifications of engines A and B
The applicability and limitations of the proposed method could be evaluated across a broad operational spectrum by selecting engines with distinct operating characteristics. Both engines employ crank angle encoders that enable precise synchronization between the crank angle and combustion pressure.
3.3 Data Extraction and Numerical Processing
P–θ diagram image files in PDF, PNG, or JPEG format were imported into the digitizer software. Axis identification was performed using three reference points, and a foreground filter was applied to isolate the target pressure curves. The point separation parameter is set to five pixels to maximize spatial resolution while avoiding excessive data clustering.
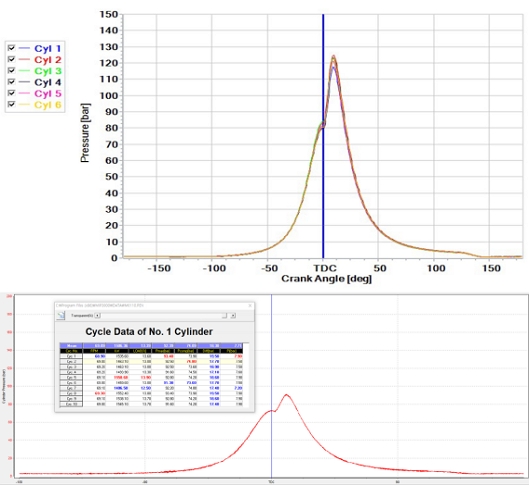
Figure 2 presents representative examples of the digital indicator image outputs collected from the operating vessels. The two engines differed in screen layout, degree of curve overlap, and information density, which could have affected the coordinate extraction accuracy during the digitizing process. In particular, when the curve gradient becomes steep near the peak-pressure region or when auxiliary markers overlap the pressure trace, image-based extraction errors are likely to increase.
P-θ diagram images from digital indicators of Engine A and Engine B
Approximately 240 and 460 data points per cycle were extracted for Engine A and Engine B, respectively. The unevenly spaced data were converted into uniformly spaced crank-angle data from −180° to +180° at intervals of 0.1°, selected as a balance between computational efficiency and sufficient angular resolution for combustion analysis.
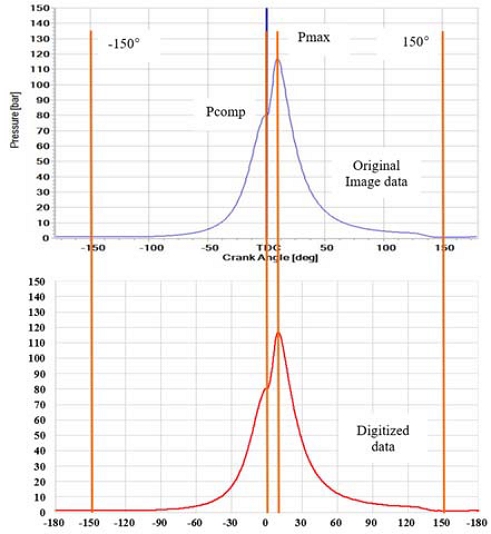
Figure 3 compares the original P–θ image with the coordinate data extracted using the digitizer. The range from −150° to +150° was selected because it sufficiently covers the principal compression and expansion features of the pressure curve while relatively reducing the influence of edge distortion in the displayed image. In addition, top dead center (TDC), Pcomp, and Pmax confirm that the proposed method preserves the overall curve shape as well as the location and form of the key performance features.
Comparison of digitized data and image data
Linear interpolation was applied to generate uniformly spaced data, followed by B-spline interpolation using the SplineTransformer algorithm from the Python scikit-learn library [10]. The final smoothed data were used for the subsequent performance analysis.
| (1) |
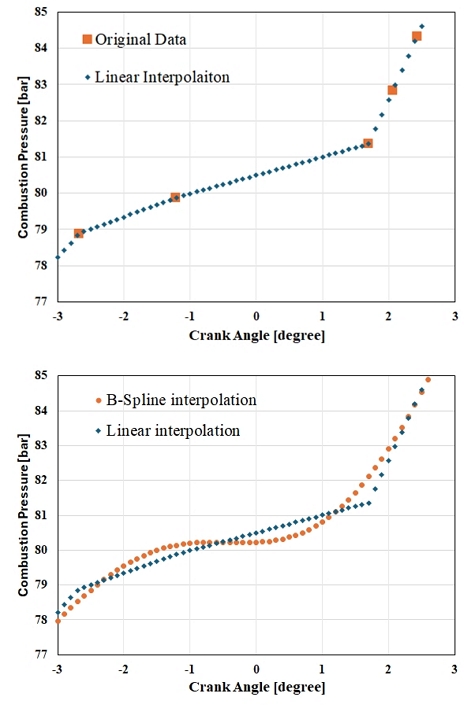
Figure 4 compares the linear and B-spline interpolations in a local region of the digitized data. Linear interpolation effectively converts irregularly extracted coordinates into uniformly spaced crank-angle data; however, abrupt slope changes may appear between adjacent points, causing numerical noise in derivative-based analyses. By contrast, B-spline interpolation reduces local discontinuities while preserving the global curve shape, providing a smoother, more continuous pressure trace. Nevertheless, excessive smoothing may flatten the actual shape near the peak pressure region; therefore, the choice of interpolation settings is important.
Linear and B-Spline interpolation
A cubic spline (k = 3) was applied for the spline interpolation. A cubic spline is suitable for engine combustion pressure analysis because it suppresses excessive vibrations while ensuring continuity and differentiability of the pressure curve. Sensitivity analysis of the smoothing coefficient s was performed for s = 45, 90, 180, and 360, as summarized in Table 2.
Sensitivity analysis of smoothing and knots
The analysis showed that s = 90 exhibited similar results in terms of Pmax, Pcomp, and pressure curve shape. However, at s = 360, a distortion of the pressure shape was observed, as the curve was excessively smoothed compared to the original data in the pressure-rise section and near the peak pressure. Therefore, considering the conservation of pressure shape, s = 90 was selected as the final setting value. Figure 5 compares the reconstructed pressure curves obtained using different smoothing coefficients.
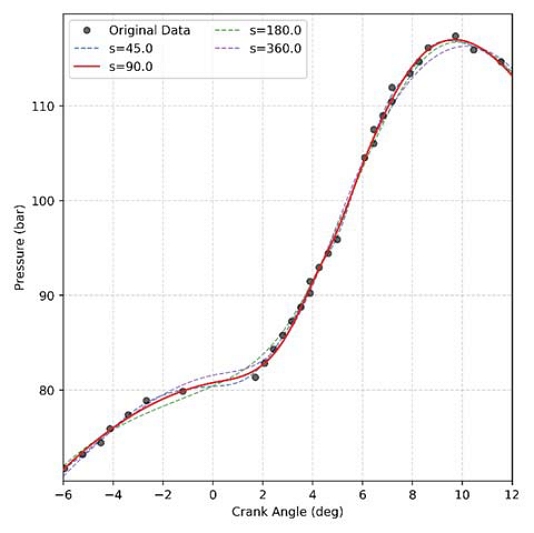
Comparison of B-spline interpolation results with different smoothing coefficients (s = 45, 90, 180, and 360)
4. Experimental Results and Discussion
The reconstructed pressure data were evaluated against the manufacturer-provided digital indicator outputs using the criteria defined in Section 3. Three parameters were selected for comparison: Pcomp and Pmax as local peak-based indicators and Pmi as an integral-based indicator. Absolute accuracy was assessed by direct deviation in bar, with ±1.25 bar adopted as the allowable error range based on the experimental uncertainty reported by Gainey et al. Trend consistency across cylinders and load conditions was evaluated separately using R² as a supplementary indicator.
The indicated mean effective pressure (Pmi) was calculated from the reconstructed pressure data by converting the crank angle into an instantaneous cylinder volume and integrating the P–V diagram over one engine cycle. The cylinder volume as a function of crank angle was determined from the engine geometry using the bore, stroke, connecting rod length, and compression ratio.
| (2) |
where Vc denotes the clearance volume, Ap is the piston area, r is the crank radius, l is the connecting rod length, and θ is the crank angle. The indicated work was obtained by numerically integrating the reconstructed P–V diagram.
| (3) |
and the indicated mean effective pressure was calculated as follows:
| (4) |
where Vs is the cylinder swept volume.
Figure 6 compares the manufacturer’s instrument outputs and the digitizer-based results for each cylinder of Engine A. Under both low- and high-load conditions, Pcomp, Pmax, and Pmi were reproduced at similar levels, and the relative distributions among the cylinders showed the same overall trend. This indicates that the proposed method cannot only reproduce average performance values but also identify cylinder-to-cylinder performance deviations. In particular, for Engine A, the deviations in the major parameters remained within the allowable error range, suggesting high practical applicability.
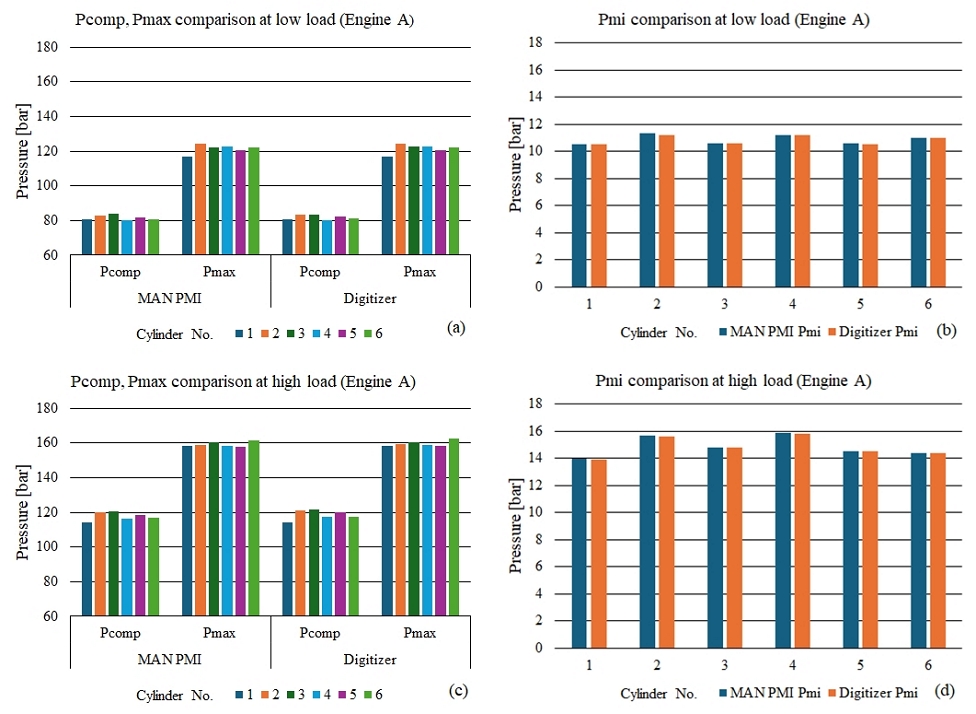
Comparison of digital indicator reference values and digitizer-based results (Engine A)
Figure 7 compares the manufacturer’s instrument outputs and the digitizer-based results for Engine B. For Engine B, Pmi exhibited generally good agreement, whereas Pmax exhibited relatively larger deviations under several cylinders and operating conditions. This was interpreted as a consequence of the steep curve gradient near the peak pressure region, where the image resolution and overlapping display elements had a stronger influence on the extracted peak coordinates. In contrast, Pmi is an integral-type indicator based on the overall pressure trace, and is therefore less sensitive to a local coordinate error at a single point.
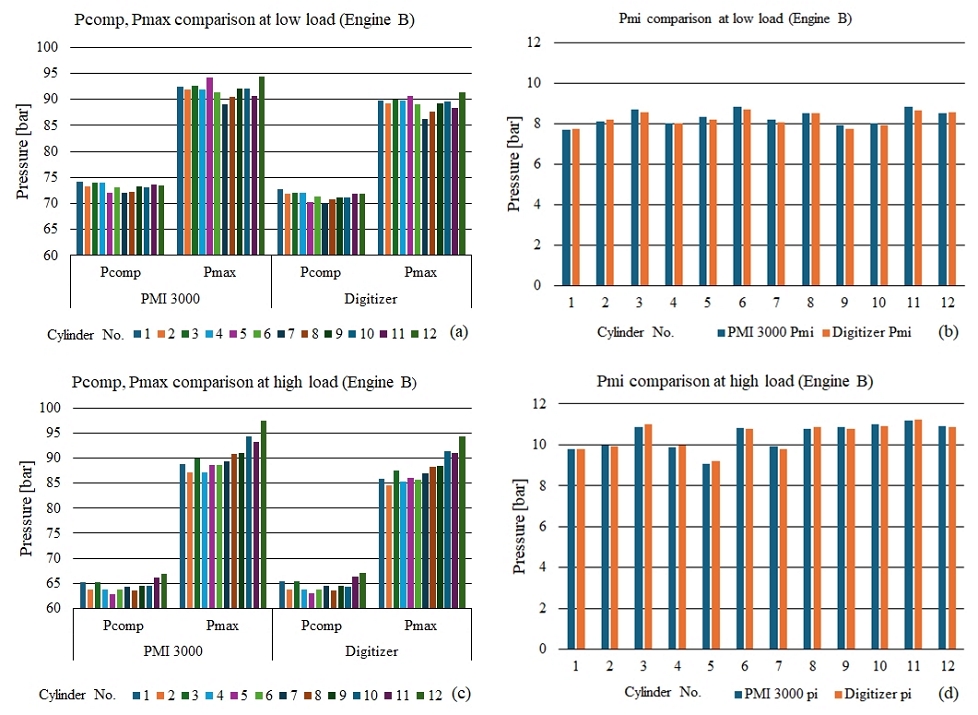
Comparison of digital indicator reference values and digitizer-based results (Engine B)
Figure 8 shows the linear correlation between the digitizer-based results and the manufacturer’s instrument outputs. A high coefficient of determination (R²) value indicates that the two datasets share a similar variation trend; however, this does not necessarily imply a small absolute error. Therefore, in this study, R² was used as a supplementary indicator of trend agreement, and the absolute accuracy was evaluated separately through a direct error comparison in bar units.
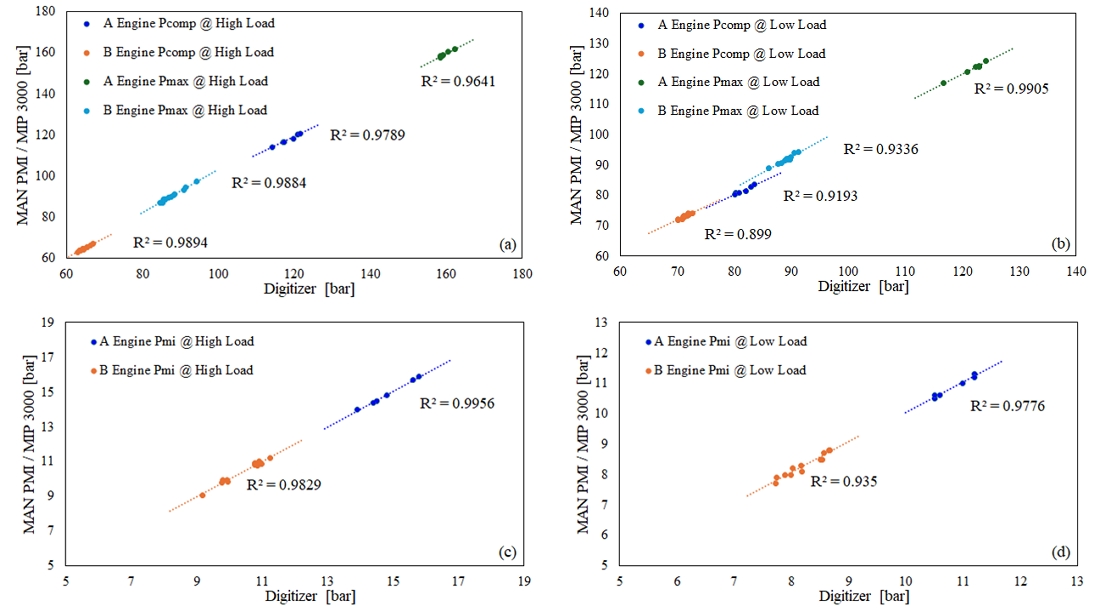
R² Plot of Pcomp/Pmax/Pmi at high/low load (a), (b), (c), (d)
As summarized in Table 3, the digitized results showed generally good agreement with the manufacturers’ outputs across engine types, load conditions, and pressure-related parameters. For Engine B, although the indicated mean effective pressure exhibited high agreement, larger deviations were observed in the maximum combustion pressure. These deviations were attributed to operational characteristics such as turbocharger cut-out at low loads and increased sensitivity to image resolution and curve overlap. The relatively small error in Pmi of Engine B was attributed to the integral-type index, which is insensitive to local coordinate errors. Although strategies such as increasing image resolution or enlarging peak areas for separate cropping and digitization can theoretically reduce coordinate-extraction errors, the digital indicator targeted in this study had a practical limitation: the user could not arbitrarily change the output resolution.
Despite absolute errors, the trend consistency between the digitized and reference data was confirmed through high coefficients of determination (R² > 0.9), indicating a strong correlation across engine types and load conditions.
The total sum of squares, regression sum of squares, and residual sum of squares were defined as follows: (yi) represents the observed value, the caret above represents the regression predicted value, and the bar above () represents the average of the observed values.
| (5) |
| (6) |
| (7) |
| (8) |
The most significant finding of this study is that reconstruction accuracy varied by performance indicator. While Pmi showed relatively high agreement for both engines, Pmax exhibited larger deviations for Engine B. This observation suggests that image-based pressure reconstruction methods may be inherently more suitable for integral-type indicators that utilize the entire pressure trace than for peak-based indicators determined by a limited number of local data points.
These findings are consistent with those of Maurya et al. [5], who emphasized that pressure correction, cycle averaging, and signal smoothing are essential for obtaining reliable combustion information from in-cylinder pressure measurements. The present results further show that the influence of signal processing depends on the type of performance indicator. Pmi, which is calculated by integrating the overall pressure trace, was reproduced more reliably than Pmax, which depends on a limited number of local data points near the pressure peak. This result also supports the observation of Kaiktsis et al. [6] that peak-pressure parameters alone may be insufficient for reliable engine condition assessment. In contrast to the studies by Rowles [7] and Ghazi and Botez [8], which reconstructed performance maps from graphical data, the present study reconstructed crank-angle-resolved in-cylinder pressure traces from indicator images obtained from operating low-speed two-stroke marine engines. Furthermore, the ±1.25 bar uncertainty reported by Gainey et al. [9] was used as a quantitative acceptance criterion rather than only as a general reference for measurement uncertainty.
Consequently, future studies should extend the validation beyond the pressure reproduction accuracy and evaluate the reliability of derivative-based combustion parameters, such as the pressure rise rate and heat release rate, which are more sensitive to local signal distortion.
5. Conclusion
This study demonstrated that a digitizer-based data acquisition framework can effectively reconstruct crank-angle-resolved in-cylinder pressure data from graphical indicator outputs when raw data access is restricted. The proposed stepwise digitization and interpolation methodology enabled quantitative engine performance analysis without additional hardware installation.
For Engine A, the reconstructed data satisfied the uncertainty criteria and were deemed suitable for detailed combustion analysis. For Engine B, while the indicated mean effective pressure was reliably reproduced, limitations were identified in reconstructing the maximum combustion pressure, highlighting the influence of the engine type and operating conditions.
Overall, the proposed method exhibited sufficient validity for cylinder-to-cylinder comparisons and trend analysis under different operating conditions. However, for indicators highly sensitive to local peaks, such as maximum combustion pressure, error may increase depending on the engine type, display format, and image resolution. Therefore, in practical applications, confidence levels should be interpreted separately for each performance indicator.
Another limitation of the proposed method is the potential introduction of user bias during the manual coordinate system definition and digitization. As the axis calibration process relies on manually selected reference points, small differences in point positioning can propagate into the reconstructed pressure data. Similarly, the choice of image-filtering conditions and smoothing parameters may influence the final pressure trace. These effects are expected to be more pronounced for performance indicators derived from local peak values, such as the maximum combustion pressure, than for integral-type indicators, such as the indicated mean effective pressure.
Despite limitations related to image resolution, TDC marker interference, and potential user-induced bias, the proposed methodology showed a strong correlation with the manufacturer-provided data. To minimize the operator-induced uncertainty, all datasets used in this study were processed using identical calibration points, filtering conditions, point extraction intervals, and spline settings.
Future work will focus on advanced combustion analyses, including the pressure rise rate, heat release rate, and ignition timing, to further support condition-based maintenance and fleet-level performance management.
Acknowledgments
This research was a part of the project titled 'Fostering Talent in Advanced Ship Blue Tech (RS-2025-02221147)' funded by the Ministry of Oceans and Fisheries, Korea.
Author Contributions
Conceptualization, M.K. Jang, J.U. Lee and J.W. Lee; Methodology, M.K. Jang, J.U. Lee and J.W. Lee; Software, M.K. Jang; Formal Analysis, M.K. Jang; Investigation, M.K. Jang; Resources, M.K. Jang; Data Curation M.K. Jang; Writing-Original Draft Preparation, M.K. Jang; Writing-Review & Editing, J.U. Lee and J.W. Lee; Visualization, M.K. Jang, J.W. Lee; Supervision, J.U. Lee and J.W. Lee; Project Administration, J.W. Lee.
References
-
K. Witkowski, “The issue of the indicator diagram analysis for the purpose of diagnosis of marine diesel engines,” Journal of KONES Powertrain and Transport, vol. 22, no. 2, pp. 293-298, 2015.
[https://doi.org/10.5604/12314005.1165456]

-
T. Kido, “Combustion data analysis by portable indicator and personal computer,” Journal of the Marine Engineering Society in Japan, vol. 27, no. 2, pp. 201-212, 1992 (in Japanese).
[https://doi.org/10.5988/jime1966.27.201]
- Engauge Digitizer, https://github.com/akhuettel/engauge-digitizer/, , Accessed July 10, 2026.
-
W. Zhou, L. Hu, and Y. Yu, “Development of online monitoring system for cylinder pressure of marine low-speed engine based on virtual instrument,” 2023 IEEE 6th Information Technology, Networking, Electronic and Automation Control Conference (ITNEC), Chongqing, China, pp. 1534-1539, 2023.
[https://doi.org/10.1109/ITNEC56291.2023.10082082]
-
R. K. Maurya, D. D. Pal, and A. K. Agarwal, “Digital signal processing of cylinder pressure data for combustion diagnostics of HCCI engine,” Mechanical Systems and Signal Processing, vol. 36, no. 1, pp. 95-109, 2013.
[https://doi.org/10.1016/j.ymssp.2011.07.014]
- P. Kaiktsis, K. Belibassakis, and G. Papadopoulos, “Electronic marine diesel engine operating data management: An approach to components' failures forecasting,” M. S. Thesis, School of Naval Architecture and Marine Engineering, National Technical University of Athens, Greece, 2020.
- J. Rowles, “Modeling brake specific fuel consumption to support exploration of doubly fed electric machines in naval engineering applications,” M. S. Thesis, Massachusetts Institute of Technology, United States, 2016.
-
G. Ghazi and R. M. Botez, “Identification and validation of an engine performance database model for the flight management system,” Journal of Aerospace Information Systems, vol. 16, no. 8, pp. 307-326, Aug. 2019.
[https://doi.org/10.2514/1.I010663]
-
B. Gainey, J. P. Longtin, and B. Lawler, “A guide to uncertainty quantification for experimental engine research and heat release analysis,” SAE International Journal of Engines, vol. 12, no. 5, pp. 509-523, Aug. 2019.
[https://doi.org/10.4271/03-12-05-0033]
- Scikit-learn Developers, “SplineTransformer,” https://scikit-learn.org/1.5/modules/generated/sklearn.preprocessing.SplineTransformer.html, , Accessed July 10, 2026.